Model-based fMRI giveth and taketh away
What’s better than fMRI or cognitive modelling? Of course, their combination in the form of model-based fMRI! Rather than evaluating simple contrasts based on the experimental design, such as where in the brain lights up more for houses vs. faces, model-based fMRI evaluates proposed cognitive processes and representations.
In this blog, we’ll first consider an example of how model-based fMRI reveals aspects of brain activity that would not easily be found by standard methods. Then, we’ll get to the main story and share a new finding with you from a large-scale neuroeconomics study called NARPS (Neuroimaging Analysis Replication and Prediction Study; bioRxiv preprint).
NARPS evaluated how the many possible ways one can analyse fMRI data can affect the conclusions researchers draw. Seventy different research labs, including our own, signed up to partake in this endeavour and were given a few months to independently complete the analyses. In NARPS, the researchers were in a sense the study participants — NARPS asked whether the analysis choices researchers make shapes basic scientific conclusions.
We went one step further and analysed the data two different ways ourselves. One analysis was fairly standard (what we thought most teams would do) whereas the other approach was model-based. As you will see below, many findings that were found in the traditional analysis were deemed spurious in the model-based analysis. Before jumping into this main story, we’ll consider an example in which model-based analysis allowed for a discovery that would not be possible with traditional methods. Model-based analysis giveth and taketh away!
Model-Based analysis giveth

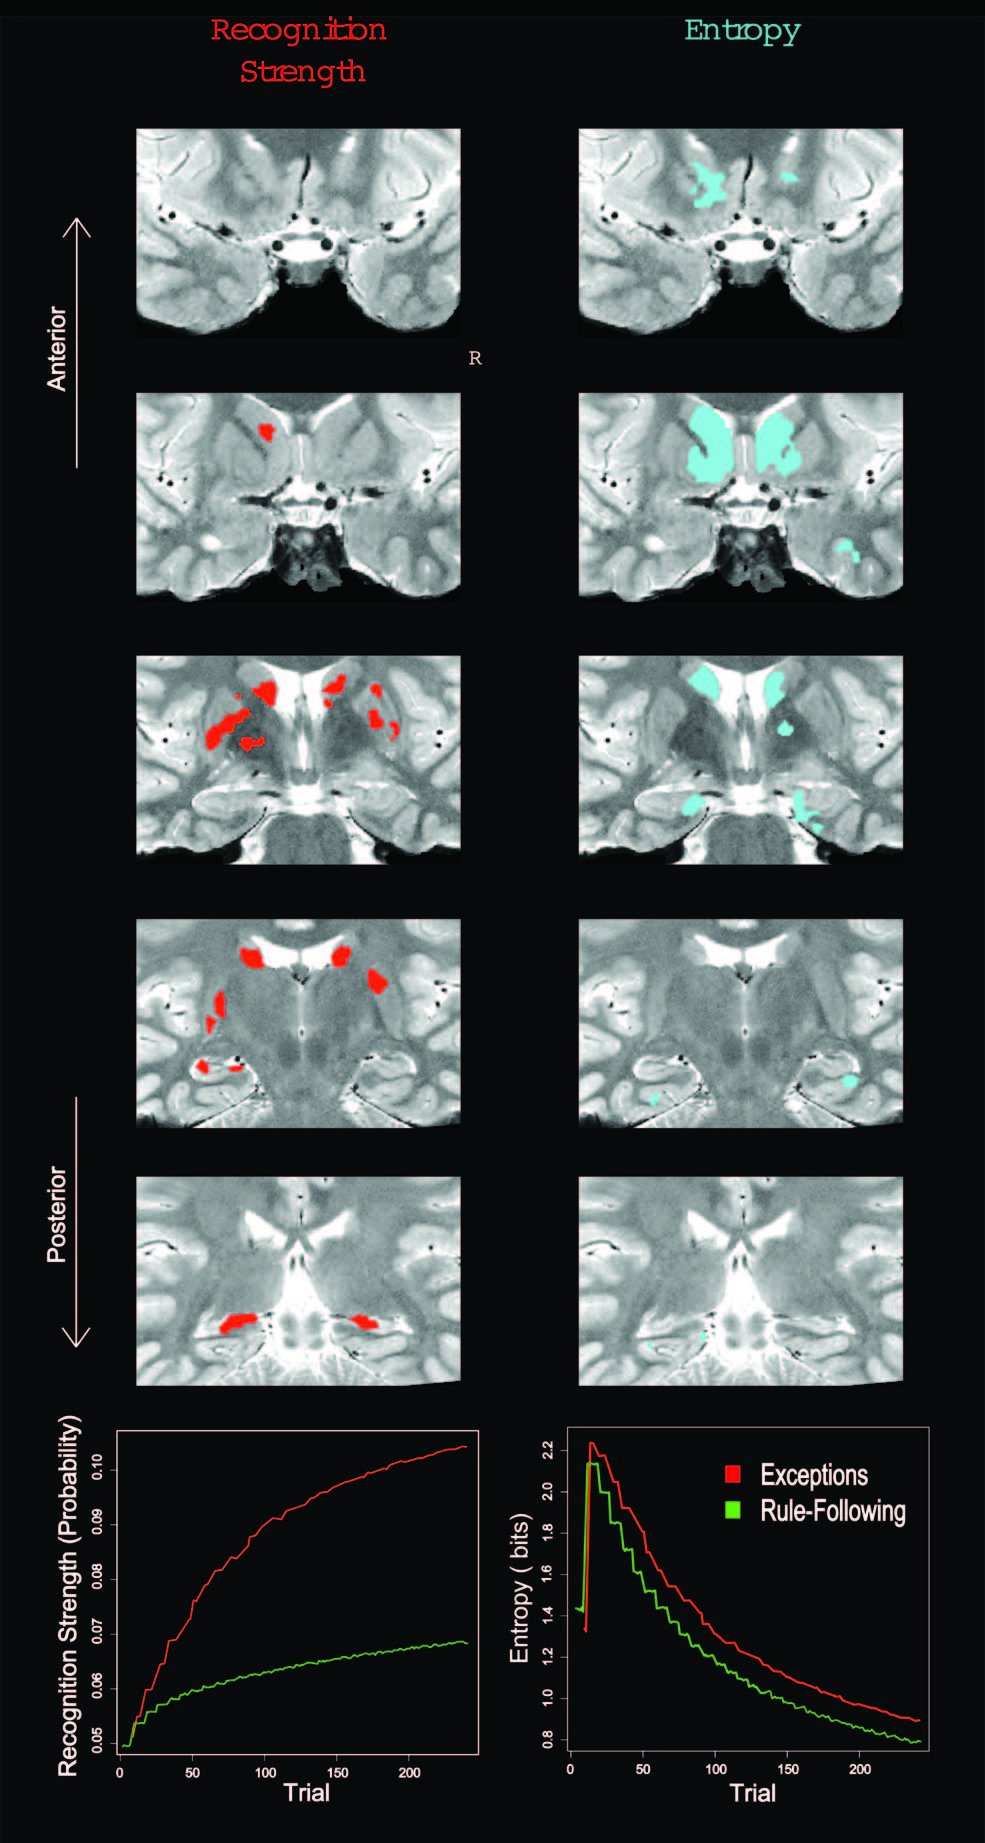
In learning studies, the time course of how representations are acquired and updated is critical. Model-based analyses, in which a cognitive model is fit to behavioural data, can be used to capture such changes across trials. In the figure above, a category learning model was fit to behaviour and then internal model measures of item recognition and category match were extracted and used to analyse the (fMRI) BOLD response in the hippocampus. In other studies of learning, model-based fMRI allowed processes in different trial phases (decision vs. feedback processing) to be isolated. The cognitive models made it possible to quantify these hypothesised mental operations that were not directly observable.
These examples focus on univariate relationships between the brain and model measure, but it is also possible to analyse patterns of activity, such as how internal representations in the model parallel patterns of activity across voxels in the brain. Of course, any model-based analysis is only as good as the model. The cognitive model should be supported by previous work, including evaluation in behavioural studies. Decoding methods can also be used to test which of a set of competing models is most consistent with the BOLD response.
Model-based analysis taketh away
The previous examples of model-based analysis revealed effects that would not otherwise be observable. Model-based analysis can also “remove” effects that are probably misleading (i.e., false alarms).
In the NARPS project, our team conducted a model-based analysis that yielded some results at odds with the standard approach. The difference we found is germane to the goal of NARPS – NARPS is interested in how the many possible data analysis pipelines for fMRI data affect our scientific conclusions. The primary goal of NARPS is to examine the variability of fMRI data analyses as carried out by different groups of researchers. Seventy different research teams signed up to partake in this endeavour and were given a few months to complete the analyses. We were one of those seventy independent teams that made NARPS possible.
Regarding the data itself, over a hundred participants engaged in a standard decision making task (like Tom et al., 2007 and De Martino et al., 2010), for more information see NARPS Data & Analysis or the bioRxiv preprint . While in the scanner they had to accept or reject gambles in the form of unbiased coin flips; each gamble could incur in either gains or losses. Participants were either in a group where the gambles were calibrated for loss aversion (equal indifference) or not (equal range).
To get at the variability in analysing fMRI data, teams performed whole-brain corrected analyses and submitted their binary (yes/no) decisions regarding nine hypotheses for specific contrasts related to previous work (Tom et al., 2007; De Martino et al., 2010; Canessa et al., 2013; Canessa et al., 2017). The hypotheses are presented in the following table along with four columns: our expected results before analyzing the data, our model-absent results (i.e., gains and losses only), our model-present results (i.e., gains, losses, and decision entropy — explained below), and prediction market results. After the submission deadline (end of February), prediction markets were organized for all hypotheses (similar to Camerer et al., 2016; Camerer et al., 2018; Dreber et al., 2015) for a little over a week at the beginning of May. The researcher prediction market closed with the values seen in the table (arbitrary token units), which were highly correlated with the fundamental values reported in the preprint.
| Expected | Gains & Losses only | Gains, Losses, & Decision Entropy | Researcher Prediction Markets | |
|---|---|---|---|---|
| Parametric effect of gain | ||||
| 1. Positive effect in ventromedial prefrontal cortex (vmPFC) - for the equal indifference group | yes | yes | no | 0.814 |
| 2. Positive effect in vmPFC - for the equal range group | yes | no | no | 0.753 |
| 3. Positive effect in ventral striatum (VS) - for the equal indifference group | yes | yes | no | 0.743 |
| 4. Positive effect in VS - for the equal range group | yes | yes | yes | 0.789 |
| Parametric effect of loss | ||||
| 5. Negative effect in vmPFC - for the equal indifference group | yes | yes | yes | 0.952 |
| 6. Negative effect in vmPFC - for the equal range group | yes | yes | yes | 0.805 |
| 7. Positive effect in amygdala - for the equal indifference group | - | no | no | 0.073 |
| 8. Positive effect in amygdala - for the equal range group | - | no | no | 0.274 |
| 9. Greater positive response to losses in amygdala for equal range condition vs. equal indifference condition. | - | no | no | 0.188 |
Our expectations and model-absent analysis
Given that the previous literature shows strong effects of value in both VS and vmPFC, we suspected that the majority of teams would answer “yes” for hypotheses 1-6. As for the hypotheses related to effects in the amygdala (hypotheses 7-9), we were indifferent given the conflicting findings for this area (e.g., Tom et al., 2007 and De Martino et al., 2010). Our initial expectations were then updated based on directly regressing gain and loss values from the experimental design onto the blood-oxygen-level dependent (BOLD) signal. However, below we explain what we think is the better model after including an additional term (i.e., inverse decision entropy) that captures something akin to decision confidence present in this task which we estimated from behaviour.
Our model
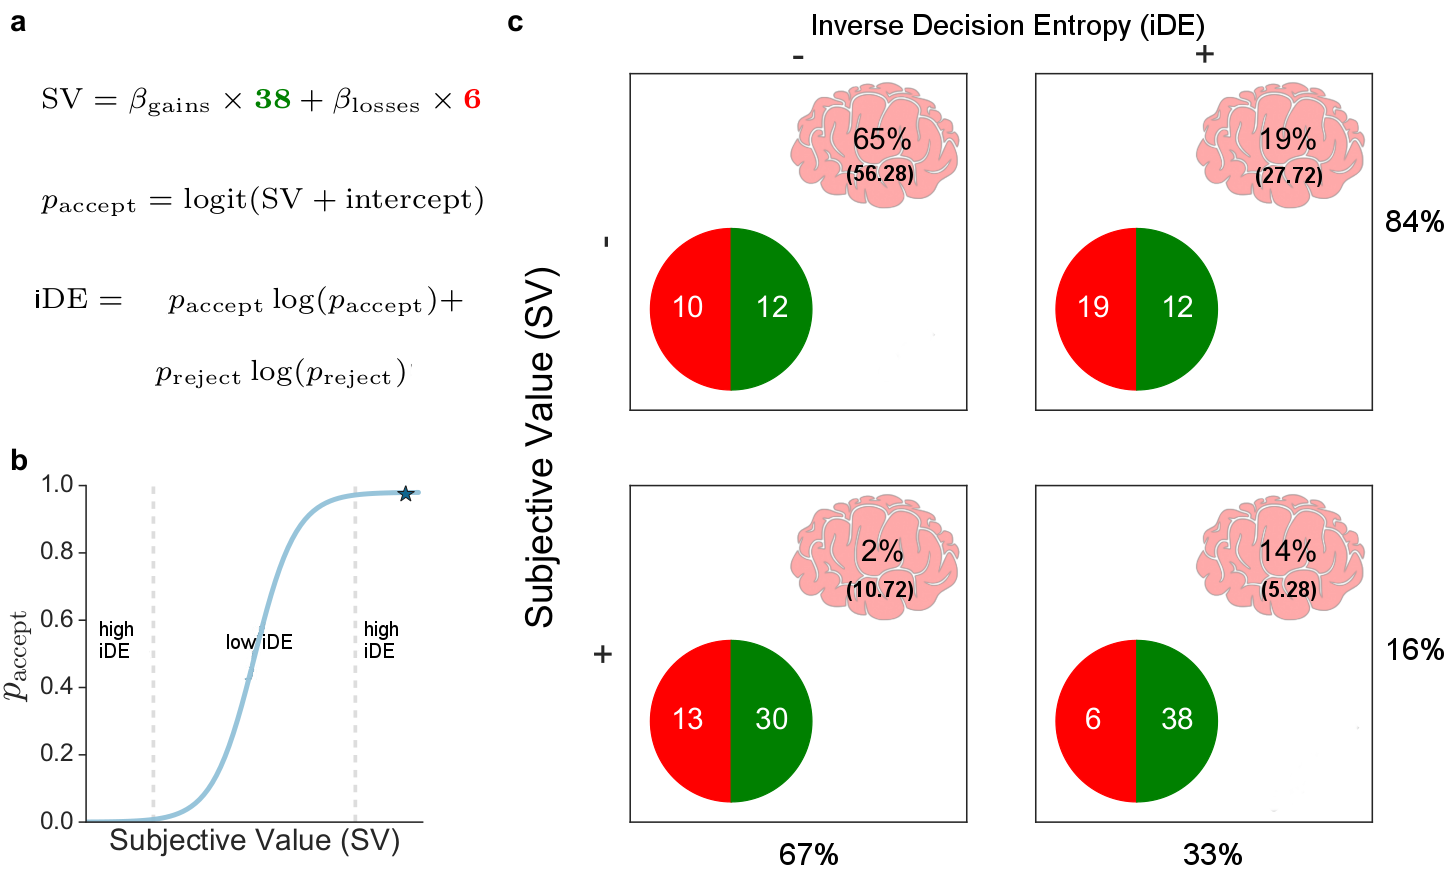
For our reported results, first, we estimated parameters from a simple cognitive model fit to behaviour: a logistic regression with an intercept and separate terms for gains and losses, predicting either accept or reject gamble. From the model’s predictions $p_{\mathrm{accept}}$, we were also able to calculate the inverse decision entropy:
\[\mathrm{iDE} = p_{\mathrm{accept}} \times log_2(p_{\mathrm{accept}}) + p_\mathrm{reject} \times log_2(p_{\mathrm{reject}})\]for each gamble (see figure below). (We use inverse decision entropy because it aligns with intuitive notions of decision confidence.) Second, the BOLD model consisted of an intercept, gains, losses, and inverse decision entropy, as well as an assortment of standard movement nuisance regressors (i.e., rotations, translations, and framewise displacement).

Our results
With respect to our model, which included inverse decision entropy as another term, we only found sufficient evidence to support hypotheses 4, 5 and 6. These results are surprising as the literature might lead one to expect that effects should be stronger for hypotheses 1-3. Instead, our model-based analysis’s inclusion of the entropy term led to these hypotheses not being supported. Had we not included inverse decision entropy in the model, we would have also answered affirmatively to hypotheses 1 and 3.
The contrast in results for the standard and model-based analysis demonstrates the importance of model-based fMRI analyses in interpreting results. Unlike the previous cases considered, where model-based analysis revealed effects that would not otherwise be found, here including appropriate terms (e.g., entropy) led to effects no longer being observed. Given that uncertainty is a critical factor in this task, we believe that including this cognitive construct into the analysis provides a more accurate view on the data.
Rather than model-based analysis simply being a more technical analysis in some senses, it should be be seen as more conceptually correct when the cognitive model used captures important aspects of participants’ mental states. Although the model-based analysis we presented was very simple, it successfully leveraged the behavioural data to better understand the imaging data.
Model-based analysis giveth: Part II
From one perspective, the model-based analyses, which included a measure of entropy for each gamble decision, rendered a number of value effects non-significant. This is likely a good thing as the standard parametric analysis did not take into account important cognitive processes related to confidence, such as the cognitive model’s entropy measure.
From another perspective, the model-based analyses revealed a bunch of qualitatively new findings related to entropy. The entropy side of the story appears bigger and more exciting than the value one. To learn more about entropy and its relation to value, you can check out the poster we presented at SfN: The neural link between subjective value and decision entropy, or better yet, our bioRxiv preprint. There we focus on the importance of decision entropy with respect to subjective value (as opposed to gains and losses separately, as we have reported here).
Finally, we would like to thank the participants in the study, all the members of the 70 participating labs, and the NARPS organisers. In addition to providing such a fine dataset, a formal assessment of variability in the fMRI processing pipeline was long overdue. Organising such projects is a lot of work, but it needs to be done. We hope this blog helps advance the aims of understanding how analysis choices affect scientific conclusions.


